| General Information of Stars 1 |
| General Information of Stars 1 |
|
Definition A star is a massive, luminous ball of plasma. Stars group together to form galaxies, and they dominate the visible universe. The nearest star to Earth is the Sun, which is the source of most of the energy on Earth, including daylight. Other stars are visible in the night sky, when they are not outshone by the Sun. A star shines because nuclear fusion in its core releases energy which traverses the star's interior and then radiates into outer space. Without stars, life and most atomic elements present in the Universe would not exist. Astronomers can determine the mass, age, chemical composition and many other properties of a star by observing its spectrum, luminosity and motion through space. The total mass of a star is the principal determinant in its evolution and eventual fate. Other characteristics of a star that are determined by its evolutionary history include the diameter, rotation, movement and temperature. A plot of the temperature of many stars against their luminosities, known as a Hertzsprung-Russell diagram (H-R diagram), allows the current age and evolutionary state of a particular star to be determined.
|
||||||||||||||||||||||||||||||||||||
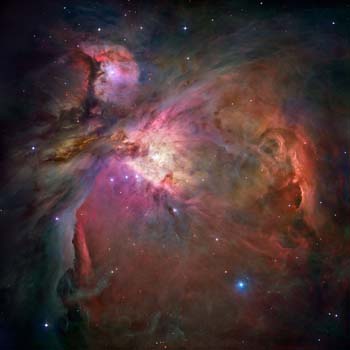
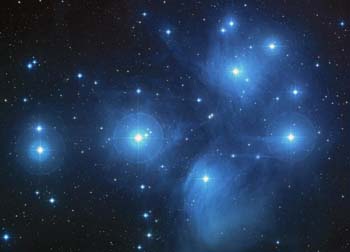
Orion Nebula |
Formation and evolution The formation of a star begins with a gravitational instability inside a molecular cloud, often triggered by shockwaves from supernovae (massive stellar explosions) or the collision of two galaxies (as in a starburst galaxy). Once a region reaches a sufficient density of matter to satisfy the criteria for Jeans Instability it begins to collapse under its own gravitational force. As the cloud collapses, individual conglomerations of dense dust and gas form that are known as Bok globules. These can contain up to 50 solar masses of material. As a globule collapses and the density increases, the gravitational energy is converted into heat and the temperature rises. When the protostellar cloud has approximately reached the stable condition of hydrostatic equilibrium, a protostar forms at the core.[22] These pre-main sequence stars are often surrounded by a protoplanetary disk. The period of gravitational contraction lasts for about 10–15 million years. Early stars of less than 2 solar masses are called T Tauri stars, while those with greater mass are Herbig Ae/Be stars. These newly-born stars emit jets of gas along their axis of rotation, producing small patches of nebulosity known as Herbig-Haro objects.[23] Stars spend about 90% of their lifetime fusing hydrogen to produce helium in high-temperature and high-pressure reactions near the core. Such stars are said to be on the main sequence and are called dwarf stars. Starting at zero-age main sequence, the proportion of helium in a star's core will steadily increase. As a consequence, in order to maintain the required rate of nuclear fusion at the core, the star will slowly increase in temperature and luminosity.[24] The Sun, for example, is estimated to have increased in luminosity by about 40% since it reached the main sequence 4.6 billion years ago.[25] Every star generates a stellar wind of particles that causes a continual outflow of gas into space. For most stars, the amount of mass lost is negligible. The Sun loses 10−14 solar masses every year,[26] or about 0.01% of its total mass over its entire lifespan. However very massive stars can lose 10−7 to 10−5 solar masses each year, significantly affecting their evolution.[27] Stars that begin with more than 50 solar masses can lose over half their total mass while they remain on the main sequence.[28] The duration that a star spends on the main sequence depends primarily on the amount of fuel it has to burn and the rate at which it burns that fuel. In other words, its initial mass and its luminosity. For the Sun, this is estimated to be about 1010 years. Large stars burn their fuel very rapidly and are short-lived. Small stars (called red dwarfs) burn their fuel very slowly and last tens to hundreds of billions of years. At the end of their lives, they simply become dimmer and dimmer, fading into black dwarfs.[2] However, since the lifespan of such stars is greater than the current age of the universe (13.7 billion years), no black dwarfs are expected to exist yet. Besides mass, the portion of elements heavier than helium can play a significant role in the evolution of stars. In astronomy all elements heavier than helium are considered a "metal", and the chemical concentration of these elements is called the metallicity. The metallicity can influence the duration that a star will burn its fuel, control the formation of magnetic fields[29] and modify the strength of the stellar wind.[30] Older, population II stars have substantially less metallicity than the younger, population I stars due to the composition of the molecular clouds from which they formed. (Over time these clouds become increasingly enriched in heavier elements as older stars die and shed portions of their atmospheres.)
|
||||||||||||||||||||||||||||||||||||
Groupings and distribution
|
|||||||||||||||||||||||||||||||||||||
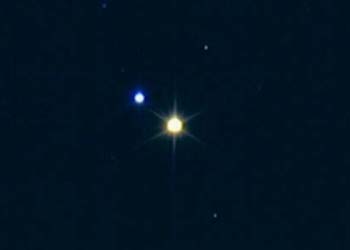
Beta Cygni (Albireo) is a multiple system with 3 visual components and 2 more discover by speckle interferometry. |
Binary stars and multiple systems The stars normally are bound gravitationally with other stars, forming binaries or multiple systems. A binary star is formed by two stars that orbit one to the other, around the center of its masses and united by the mutual gravitational pull. Each one of them moves following elliptical orbits the rededor of its common center of gravity. Between nearer more express it is the moved away cycle of each orbit and between more but slow. Their orbital periods can measure of a few to million years. The origin of a binary system can be or so that the components that integrate it formed simultaneously of the same cloud of original matter or because, possibly, a star is catched by another one in its trip by the galaxy. Multiple star systems or physical multiple stars are systems of more than two stars. Multiple star systems are called triple, trinary or ternary if they contain three stars; quadruple or quaternary if they contain four stars; quintuple with five stars; sextuple with six stars; septuple with seven stars; and so on.
|
||||||||||||||||||||||||||||||||||||
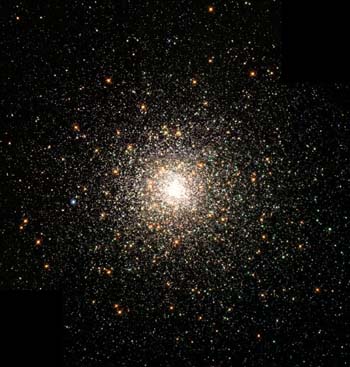
M80 |
Star clusters Star clusters are groups of stars which are gravitationally bound. Two distinct types of star cluster can be distinguished: globular clusters are tight groups of hundreds of thousands of very old stars, while open clusters generally contain less than a few hundred members, and are often very young. Open clusters become disrupted over time by the gravitational influence of giant molecular clouds as they move through the galaxy, but cluster members will continue to move in broadly the same direction through space even though they are no longer gravitationally bound; they are then known as a stellar association, sometimes also referred to as a moving group. Single Stars Not all the stars maintain gravitational bows with other stars; like the Sun, they travel in a solitary way, having itself separated long ago of the stellar group in which they formed. However, these isolated stars obey to the global gravitational field constituted by the superposition of gravitational fields of the total objects in the galaxy: black holes, clusters, multiple and binary stars, nebulas, etc.
|
||||||||||||||||||||||||||||||||||||
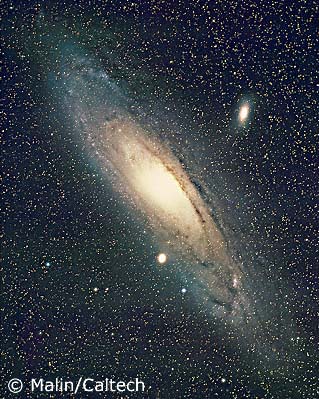
Andrómeda (M31) is a spiral galaxy like ours, but much larger. Its diameter is 200,000 light years long (Milky Way has 110,000 ly) and is to 2,000,000 ly of distance. It is the closest spiral galaxy to us and is the bigger member of our local group of galaxies. |
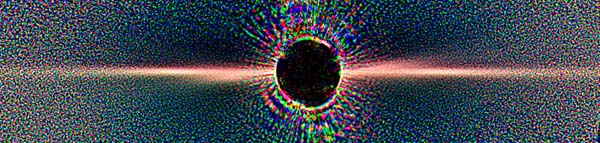
Beta Pictoris |
||||||||||||||||||||||||||||||||||||
Other Solar Systems
Until 1988 evidence of other planetary systems was not had, and since then to August of 2007 the account reaches 249 extrasolar planets, with masses between one and ten times the Jupiter mass, like the planet discovered in Epsilon Eridani in 2000.
It has been a long-held assumption that the majority of stars occur in gravitationally-bound, multiple-star systems, forming binary stars. This is particularly true for very massive O and B class stars, where 80% of the systems are believed to be multiple. However the portion of single star systems increases for smaller stars, so that only 25% of red dwarfs are known to have stellar companions. As 85% of all stars are red dwarfs, most stars in the Milky Way are likely single from birth. Larger groups called star clusters also exist. These range from loose stellar associations with only a few stars, up to enormous globular clusters with hundreds of thousands of stars. Stars are not spread uniformly across the universe, but are normally grouped into galaxies along with interstellar gas and dust. A typical galaxy contains hundreds of billions of stars, and there are more than 100 billion galaxies in the observable universe. While it is often believed that stars only exist within galaxies, intergalactic stars have been discovered. Astronomers estimate that there are at least 70 sextillion (7×10²²) stars in the observable universe. That is 230 billion times as many as the 300 billion in the Milky Way. The nearest star to the Earth, apart from the Sun, is Proxima Centauri, which is 39.9 trillion kilometers, or 4.2 light-years away. Light from Proxima Centauri takes 4.2 years to reach Earth. Travelling at the orbital speed of the Space Shuttle (5 miles per second — almost 30,000 kilometers per hour), it would take about 150,000 years to get there. Distances like this are typical inside galactic discs, including in the vicinity of the solar system. Stars can be much closer to each other in the centers of galaxies and in globular clusters, or much farther apart in galactic halos. Due to the relatively vast distances between stars outside the galactic nucleus, collisions between stars are thought to be rare. In denser regions such as the core of globular clusters or the galactic center, collisions can be more common. Such collisions can produce what are known as blue stragglers. These abnormal stars have a higher surface temperature than the other main sequence stars with the same luminosity in the cluster. |
|||||||||||||||||||||||||||||||||||||
Classification The first stellar classification was made by Hipparchus and preserved in the Western Culture through Ptolemy, in its work almagest. This system classified stars by the intensity of its optical brightness as seen from the Earth.
|
|||||||||||||||||||||||||||||||||||||
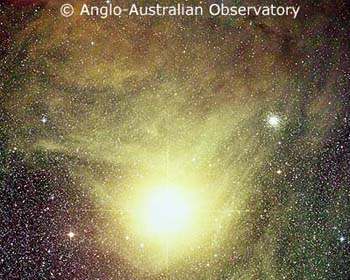
Antares is a dying red supergiant, surrounded by a dust and particles cloud that throw to the space in a cooling process in order to maintain their stability. It measures 300 times the solar diameter, is M1.5lab spectral type, pulsating variable and is 425 light years away. |
Spectral type The category to which a star is assigned according to the characteristics of its spectrum. The classification scheme in use today has evolved from that devised at Harvard College Observatory at the end of the ninteenth century in which stars were grouped into 16 classes from A to Q. Advances in stellar astronomy led to many of these original spectral classes being dropped and others rearranged, so that the modern classification scheme of stellar spectra consists of seven main groups which form a temperature. From hottest to coolest they are: O, B, A, F, G, K, and M.
|
||||||||||||||||||||||||||||||||||||
|
|||||||||||||||||||||||||||||||||||||
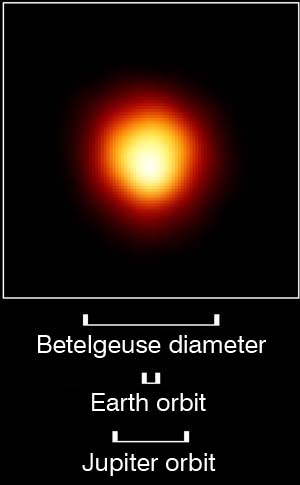
The Orion main star, Betelgeuse, is a red luminous supergiant, spectral type M1-2la-lab, pulsating variable and is the A component in a multiple system with 4 visual components and 2 more discovered by spectroscopy and speckle interferometry. It is to 310 light years from the Sun. |
Luminosity class The spectral type classification of Harvard does not completely determine the characteristics of a star. Stars with the same temperature can have very different sizes, which imply very different luminosities. In order to distinguish them they were defined in Yerkes, the classes of luminosity. In this system of classification the stellar spectra is examined again and look for spectral lines sensible to the gravity of star. This way it is possible to consider his size.
Both systems of classification are complementary. |
||||||||||||||||||||||||||||||||||||
Main sequence The curving track on the Hertzsprung-Russell diagram, from top left (high temperature, high luminosity) to lower right (low temperature, low luminosity), along which 90% of visible stars lie. A star on the main sequence is one that is generating light and heat by the conversion of hydrogen to helium by nuclear fusion in its core. The Sun, along with the bulk of the stars visible to the naked eye, are main sequence stars.
|
|||||||||||||||||||||||||||||||||||||
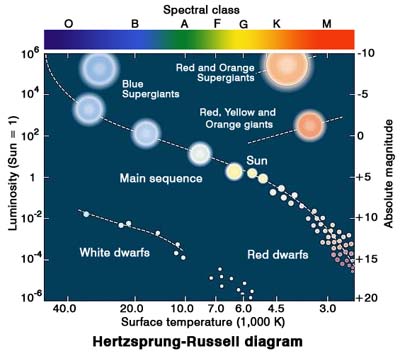 |
The Hertzsprung-Russell diagram (commonly been brief as HR diagram) shows the result of numerous observations on existing relation between the absolute magnitude, surface temperature, spectral class and luminosity of stars was made in 1911 by astronomer Ejnar Hertzsprung and, of independent way, in 1913 by Henry Norris Russell. The Hertzsprung diagram showed the luminosity of stars based on its color, whereas the initial Russell diagram showed the luminosity based on the spectral type. Both diagrams are equivalent. |
||||||||||||||||||||||||||||||||||||
|